In this post, I show you how to integrate the ECharts library into an Ionic application. ECharts is an open-source, free-to-use chart library, released under the Apache license. Baidu, the Chinese search company, initially developed the library, and it is now under the umbrella of the Apache foundation. ECharts draws diagrams and charts into a canvas element, and it provides a renderer that draws the charts with SVG.
The library provides many chart types out of the box. The demo page is a good place to start and see all the diagrams and charts in action: https://echarts.apache.org/examples/en/
The documentation page of ECharts describes all the configuration options and methods.
API: https://echarts.apache.org/en/api.html#echarts
Option: https://echarts.apache.org/en/option.html
What we want to do in this post is create an Ionic app and display some simple charts. For the following examples, I copied the configuration objects directly from the ECharts demo page.
Setup 
We start with the Ionic command-line tool and create a new app based on the tabs template.
ionic start echartsapp tabs
Next, we install the ECharts library and the ngx-echarts library, which provides an Angular directive that allows us to integrate ECharts into an Angular app very easily. See also the project page of ngx-echarts for the latest documentation.
npm install echarts
npm install ngx-echarts
npm install @juggle/resize-observer
Next, we have to import provideEchartsCore and the echarts components we want to use in our application.
import {provideEchartsCore} from 'ngx-echarts';

import * as echarts from 'echarts/core';
import {
  CalendarComponent,
  GridComponent,
  LegendComponent,
  TitleComponent,
  TooltipComponent,
  VisualMapComponent
} from 'echarts/components';
import {BarChart, GaugeChart, GraphChart, HeatmapChart, LineChart} from 'echarts/charts';
import {CanvasRenderer} from 'echarts/renderers';
Then configure the imported components with echarts.use().
echarts.use([GridComponent, TitleComponent, TooltipComponent, LegendComponent, CalendarComponent, VisualMapComponent,
  BarChart, LineChart, GaugeChart, GraphChart, HeatmapChart, CanvasRenderer]);
Finally, provide echarts with the provideEchartsCore function in the providers array.
provideEchartsCore({echarts}),
Example app 
Next, we create a few pages that host our examples.
ionic g page chart1
ionic g page chart2
ionic g page chart3
ionic g page chart4
ionic g page chart5
ionic g page chart6
You can delete all the other pages that the start command created (about, contact, home).
Directive 
Before we continue with the example, let's take a quick look at the ngx-echarts library and the echarts directive that the library provides.
To display an ECharts diagram, you add the echarts directive to a div tag in your template.
<div [options]="options" class="demo-chart" echarts></div>
The input property options configures the chart.
  options: EChartsOption = {
    color: ['#3398DB'],
Remember to import the NgxEchartsDirective directive.
imports: [NgxEchartsDirective, IonHeader, IonToolbar, IonContent, IonTitle]
The echarts directive supports the following properties:
| Property | Description |
|---|---|
[options] |
The object that describes the chart. You find many examples on the ECharts example page. Often you can simply copy and paste the option object from there and tweak it according to your needs. |
[merge] |
Used for updating parts of the options. The object is being merged with echartsInstance.setOption() and notMerge = false. |
[loading] |
Shows the ECharts loading animation when the data is not ready. Defaults to false. |
[loadingOpts] |
Option to customize the loading animation. Only used when [loading] is true. See the documentation for the supported configuration properties. |
[autoResize] |
Automatically resizes the chart when the size of the parent container changes. By default, true. |
[initOpts] |
Object used for the echarts.init() call. For example, you can change the renderer from canvas to SVG. |
[theme] |
String that specifies the theme to use. In the following second example, we're going to see a different theme. |
[detectEventChanges] |
Specifies if a mouse event handler should be registered on the echart instance. By default, set to true. |
Chart 1 
The template for the first example is straightforward. We add the echarts directive to a div tag and inject the options object from the TypeScript code into the directive.
<ion-content>
  <div [options]="options" class="demo-chart" echarts></div>
</ion-content>
In the TypeScript file, we set up the options object.
import {Component} from '@angular/core';
import {EChartsOption} from 'echarts';
import {NgxEchartsDirective} from 'ngx-echarts';
import {IonContent, IonHeader, IonTitle, IonToolbar} from "@ionic/angular/standalone";

@Component({
  selector: 'app-chart1',
  templateUrl: 'chart1.html',
  styleUrl: './chart1.scss',
  imports: [NgxEchartsDirective, IonHeader, IonToolbar, IonContent, IonTitle]
})
export class Chart1Page {

  options: EChartsOption = {
    color: ['#3398DB'],
    grid: {
      left: '3%',
      right: '4%',
      bottom: '3%',
      containLabel: true
    },
    xAxis: [
      {
        type: 'category',
        data: ['Mon', 'Tue', 'Wed', 'Thu', 'Fri', 'Sat', 'Sun'],
        axisTick: {
          alignWithLabel: true
        }
      }
    ],
    yAxis: [
      {
        type: 'value'
      }
    ],
    series: [
      {
        name: 'Test',
        type: 'bar',
        barWidth: '60%',
        data: [10, 52, 200, 334, 390, 330, 220]
      }
    ]
  };

}
Finally, we add some styles to the SCSS file. We have to assign a width and a height to the div element that surrounds the canvas.
@media screen and (orientation: portrait) {
  .demo-chart {
    width: 100vw;
    height: 82vh;
  }
}

@media screen and (orientation: landscape) {
  .demo-chart {
    width: 100vw;
    height: 68vh;
  }
}
Now you can start the app with ionic serve, and you should see the following chart on the first tab.
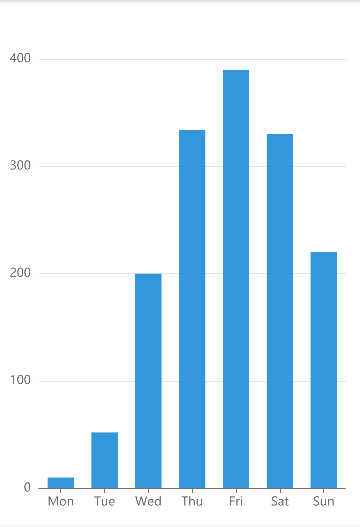
Chart 2 
The second chart is built the same way as the first one. The only difference is the ECharts config object.
<ion-content>
  <div [options]="options" class="demo-chart" echarts theme="dark"></div>
</ion-content>
import {Component} from '@angular/core';
import {EChartsOption} from 'echarts';
import {NgxEchartsDirective} from 'ngx-echarts';
import {IonContent, IonHeader, IonTitle, IonToolbar} from "@ionic/angular/standalone";

@Component({
  selector: 'app-chart2',
  templateUrl: 'chart2.html',
  styleUrl: './chart2.scss',
  imports: [NgxEchartsDirective, IonHeader, IonToolbar, IonTitle, IonContent]
})
export class Chart2Page {

  options: EChartsOption = {
    legend: {
      data: ['Profit', 'Expenses', 'Income']
    },
    grid: {
      left: '3%',
      right: '4%',
      bottom: '3%',
      containLabel: true
    },
    xAxis: [
      {
        type: 'value'
      }
    ],
    yAxis: [
      {
        type: 'category',
        axisTick: {show: false},
        data: ['Monday', 'Tuesday', 'Wednesday', 'Thursday', 'Friday', 'Saturday', 'Sunday']
      }
    ],
    series: [
      {
        name: 'Profit',
        type: 'bar',
        label: {
          show: true,
          position: 'inside'
        },
        data: [200, 170, 240, 244, 200, 220, 210]
      },
      {
        name: 'Income',
        type: 'bar',
        stack: 'Total',
        label: {
          show: true
        },
        data: [320, 302, 341, 374, 390, 450, 420]
      },
      {
        name: 'Expenses',
        type: 'bar',
        stack: 'Total',
        label: {
          show: true,
          position: 'left'
        },
        data: [-120, -132, -101, -134, -190, -230, -210]
      }
    ]
  };
}
For this example, we use a different theme. In the template, we specify the theme with theme="dark".
The ECharts library provides several pre-built themes. You find the names of the themes in the node_modules/echarts/theme directory.
Another thing I want to demonstrate with this example is that the charts have some interactivity built-in. In this chart, you can click or tap on a legend item, and the chart hides or shows the corresponding data series.
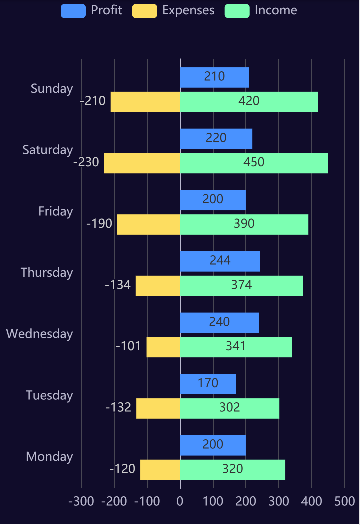
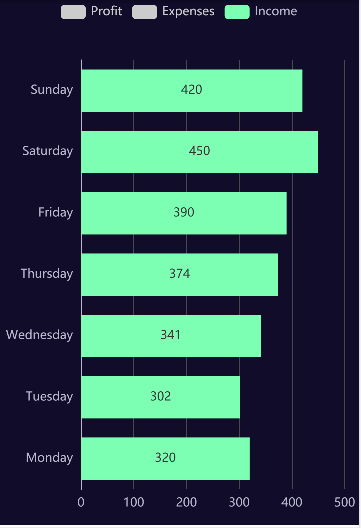
Chart 3 
The third chart demonstrates a way to update the data of a chart on the fly. When you click or tap the start button, the application starts a function with setInterval that updates the data every two seconds with a random value.
The echarts directive supports the options property that contains the initial configuration and the merge property, which allows an application to update parts of the options.
<ion-header>
  <ion-toolbar>
    <ion-title>Chart 3</ion-title>
  </ion-toolbar>
</ion-header>

<ion-content>
  <div [merge]="datas" [options]="options" class="demo-chart" echarts></div>
</ion-content>

<ion-footer>
  <ion-button (click)="start()" [disabled]="running" color="secondary" expand="block">Start</ion-button>
  <ion-button (click)="stop()" [disabled]="!running" color="danger" expand="block">Stop</ion-button>
</ion-footer>
The application must assign a new object to the datas instance variable each time it wants to set a new value.
this.datas = {
  series: [{
    data: [{value: Number((Math.random() * 100).toFixed(1))}]
  }]
};
It would not work when you only change the value like this:
this.datas.series[0].data[0].value = Number((Math.random() * 100).toFixed(1))
The echarts directive only picks up the change when the reference to the datas object changes.
import {Component} from '@angular/core';
import {EChartsOption} from 'echarts';
import {NgxEchartsDirective} from 'ngx-echarts';
import {IonButton, IonContent, IonFooter, IonHeader, IonTitle, IonToolbar} from "@ionic/angular/standalone";

@Component({
  selector: 'app-chart3',
  templateUrl: 'chart3.html',
  styleUrl: './chart3.scss',
  imports: [NgxEchartsDirective, IonHeader, IonToolbar, IonTitle, IonContent, IonFooter, IonButton]
})
export class Chart3Page {

  running = false;
  options: EChartsOption = {
    series: [{
      type: 'gauge',
      detail: {formatter: '{value}%'},
      data: [{value: 50, name: 'Sensor'}]
    }]
  };
  datas: EChartsOption = {};
  private interval: number | null = null;

  start(): void {
    this.running = true;
    this.interval = window.setInterval(() => {
      this.datas = {
        series: [{
          data: [{value: Number((Math.random() * 100).toFixed(1))}]
        }]
      };
    }, 2000);
  }

  stop(): void {
    this.running = false;
    if (this.interval) {
      clearInterval(this.interval);
    }
  }

}
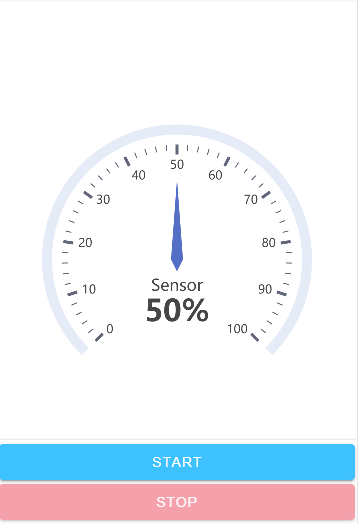
Chart 4 
The fourth example displays a simple graph. The template page and TypeScript code are similar to the other examples.
<ion-header>
  <ion-toolbar>
    <ion-title>Chart 4</ion-title>
  </ion-toolbar>
</ion-header>

<ion-content>
  <div [options]="options" class="demo-chart" echarts></div>
</ion-content>
import {Component} from '@angular/core';
import {EChartsOption} from 'echarts';
import {NgxEchartsDirective} from 'ngx-echarts';
import {IonContent, IonHeader, IonTitle, IonToolbar} from "@ionic/angular/standalone";


@Component({
  selector: 'app-chart4',
  templateUrl: 'chart4.html',
  styleUrl: './chart4.scss',
  imports: [NgxEchartsDirective, IonHeader, IonToolbar, IonTitle, IonContent]
})
export class Chart4Page {

  options: EChartsOption = {
    title: {
      text: 'Graph Example'
    },
    series: [
      {
        type: 'graph',
        layout: 'none',
        symbolSize: 50,
        roam: true,
        label: {
          show: true
        },
        edgeSymbol: ['circle', 'arrow'],
        edgeSymbolSize: [4, 10],
        data: [{
          name: 'Node 1',
          x: 300,
          y: 300
        }, {
          name: 'Node 2',
          x: 800,
          y: 300
        }, {
          name: 'Node 3',
          x: 550,
          y: 100
        }, {
          name: 'Node 4',
          x: 550,
          y: 500
        }],
        // links: [],
        links: [{
          source: 0,
          target: 1,
          symbolSize: [5, 20],
          label: {
            show: true
          },
          lineStyle: {
            width: 5,
            curveness: 0.2
          }
        }, {
          source: 'Node 2',
          target: 'Node 1',
          label: {
            show: true
          },
          lineStyle: {
            curveness: 0.2
          }
        }, {
          source: 'Node 1',
          target: 'Node 3'
        }, {
          source: 'Node 2',
          target: 'Node 3'
        }, {
          source: 'Node 2',
          target: 'Node 4'
        }, {
          source: 'Node 1',
          target: 'Node 4'
        }],
        lineStyle: {
          opacity: 0.9,
          width: 2,
          curveness: 0
        }
      }
    ]
  };

}
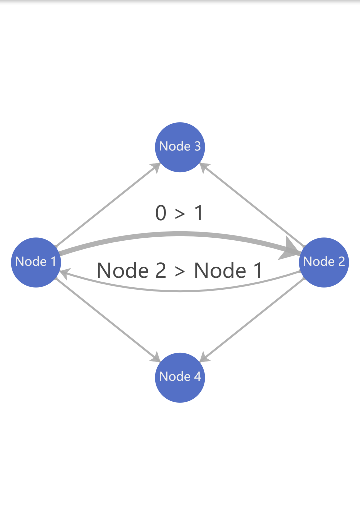
Chart 5 
The next chart displays a heatmap. The template page and TypeScript code are similar to the previous examples. Like in the second example, you can interact with the legend.
<ion-header>
  <ion-toolbar>
    <ion-title>Chart 5</ion-title>
  </ion-toolbar>
</ion-header>

<ion-content>
  <div [options]="options" class="demo-chart" echarts></div>
</ion-content>
import {Component} from '@angular/core';
import {format} from 'date-fns';
import {EChartsOption} from 'echarts';
import {NgxEchartsDirective} from 'ngx-echarts';
import {IonContent, IonHeader, IonTitle, IonToolbar} from "@ionic/angular/standalone";

@Component({
  selector: 'app-chart5',
  templateUrl: 'chart5.html',
  styleUrl: './chart5.scss',
  imports: [NgxEchartsDirective, IonHeader, IonToolbar, IonTitle, IonContent]
})
export class Chart5Page {

  options: EChartsOption = {
    tooltip: {
      position: 'top',
      formatter: (p: any) => p.data[0] + ': ' + p.data[1]
    },
    visualMap: {
      min: 0,
      max: 1000,
      calculable: true,
      orient: 'horizontal',
      left: 'center',
      bottom: 0,
    },
    calendar: [{
      cellSize: [10, 'auto'],
      bottom: 45,
      orient: 'vertical',
      range: '2017',
      dayLabel: {
        margin: 5
      }
    }, {
      left: 250,
      cellSize: [10, 'auto'],
      bottom: 45,
      orient: 'vertical',
      range: '2018',
      dayLabel: {
        margin: 5
      }
    }],

    series: [{
      type: 'heatmap',
      coordinateSystem: 'calendar',
      calendarIndex: 0,
      data: Chart5Page.getVirtulData(2017)
    }, {
      type: 'heatmap',
      coordinateSystem: 'calendar',
      calendarIndex: 1,
      data: Chart5Page.getVirtulData(2018)
    }]
  };

  private static getVirtulData(year = 2020): [string, number][] {
    const date = new Date(year, 0, 1).getTime();
    const end = new Date(year, 11, 31).getTime();
    const dayTime = 3600 * 24 * 1000;
    const data: [string, number][] = [];
    for (let time = date; time <= end; time += dayTime) {
      data.push([
        format(time, 'yyyy-MM-dd'),
        Math.floor(Math.random() * 1000)
      ]);
    }
    return data;
  }

}
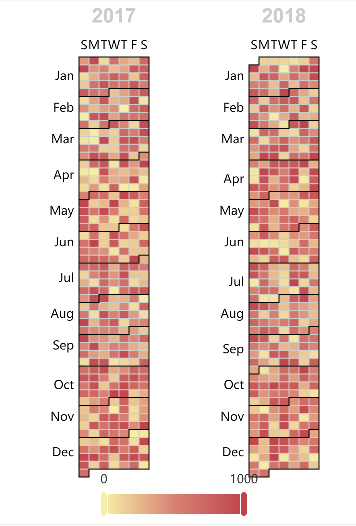
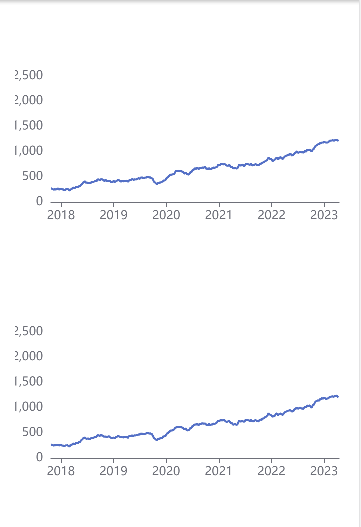
Chart 6 
The last example shows you how to embed two charts into one page. In the template page, we add
two div tags with the echarts directive.
<ion-header>
  <ion-toolbar>
    <ion-title>Chart 6</ion-title>
  </ion-toolbar>
</ion-header>

<ion-content class="ion-padding">
  <div [merge]="updateOptions1" [options]="options1" class="demo-chart" echarts></div>
  <div [merge]="updateOptions2" [options]="options2" class="demo-chart" echarts></div>
</ion-content>
In the SCSS file, we use a media query to set the height of the div dependent on the device orientation. If the device is in landscape mode, we set the height to 82% of the viewport height, and in portrait mode, we set it to 40% of the viewport height. With this style, you see both charts in portrait mode and one chart in landscape mode.
@media screen and (orientation: portrait) {
  .demo-chart {
    width: 100vw;
    height: 40vh;
  }
}

@media screen and (orientation: landscape) {
  .demo-chart {
    width: 100vw;
    height: 82vh;
  }
}
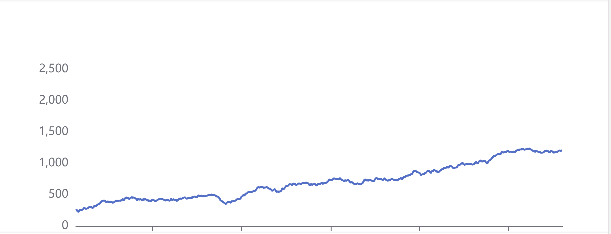
The TypeScript code defines the two configuration options (options1 and options2). When the user enters the page (ionViewWillEnter), the application starts
a job that runs every second and generates random values. Like in the third example, we use the merge option to update the chart with the new values.
import {Component} from '@angular/core';
import {ViewWillEnter, ViewWillLeave} from '@ionic/angular';
import {EChartsOption} from 'echarts';
import {NgxEchartsDirective} from 'ngx-echarts';
import {IonContent, IonHeader, IonTitle, IonToolbar} from "@ionic/angular/standalone";

type DataType = { name: string, value: [string, number] };

@Component({
  selector: 'app-chart6',
  templateUrl: 'chart6.html',
  styleUrl: './chart6.scss',
  imports: [NgxEchartsDirective, IonHeader, IonToolbar, IonTitle, IonContent]
})
export class Chart6Page implements ViewWillEnter, ViewWillLeave {
  private static oneDay = 24 * 3600 * 1000;

  data1: DataType[] = [];
  data2: DataType[] = [];
  updateOptions1!: { series: { data: DataType[] }[] };
  updateOptions2!: { series: { data: DataType[] }[] };
  options1: EChartsOption = {
    title: {
      text: 'Dynamic Data 1'
    },
    tooltip: {
      trigger: 'axis',
      formatter: (params: any) => {
        const param = params[0];
        const date = new Date(param.name);
        return date.getDate() + '/' + (date.getMonth() + 1) + '/' + date.getFullYear() + ' : ' + param.value[1];
      },
      axisPointer: {
        animation: false
      }
    },
    xAxis: {
      type: 'time',
      splitLine: {
        show: false
      }
    },
    yAxis: {
      type: 'value',
      boundaryGap: [0, '100%'],
      splitLine: {
        show: false
      }
    },
    series: [{
      name: 'Sumulation Data',
      type: 'line',
      showSymbol: false,
      data: this.data1
    }]
  };
  options2: EChartsOption = {
    title: {
      text: 'Dynamic Data 2'
    },
    tooltip: {
      trigger: 'axis',
      formatter: (params: any) => {
        const param = params[0];
        const date = new Date(param.name);
        return date.getDate() + '/' + (date.getMonth() + 1) + '/' + date.getFullYear() + ' : ' + param.value[1];
      },
      axisPointer: {
        animation: false
      }
    },
    xAxis: {
      type: 'time',
      splitLine: {
        show: false
      }
    },
    yAxis: {
      type: 'value',
      boundaryGap: [0, '100%'],
      splitLine: {
        show: false
      }
    },
    series: [{
      name: 'Sumulation Data',
      type: 'line',
      showSymbol: false,
      data: this.data2
    }]
  };
  private now = new Date(2017, 9, 3);
  private value = Math.random() * 1000;
  private randomDataInterval!: number;

  constructor() {
    for (let i = 0; i < 1000; i++) {
      this.data1.push(this.randomData());
      this.data2.push(this.randomData());
    }
  }

  ionViewWillEnter(): void {
    this.randomDataInterval = window.setInterval(() => {
      for (let i = 0; i < 5; i++) {
        this.data1.shift();
        this.data1.push(this.randomData());
        this.data2.shift();
        this.data2.push(this.randomData());
      }

      this.updateOptions1 = {
        series: [{
          data: this.data1
        }]
      };

      this.updateOptions2 = {
        series: [{
          data: this.data2
        }]
      };
    }, 1000);
  }

  ionViewWillLeave(): void {
    clearInterval(this.randomDataInterval);
  }

  private randomData(): DataType {
    this.now = new Date(+this.now + Chart6Page.oneDay);
    this.value = this.value + Math.random() * 21 - 10;
    return {
      name: this.now.toString(),
      value: [
        [this.now.getFullYear(), this.now.getMonth() + 1, this.now.getDate()].join('/'),
        Math.round(this.value)
      ]
    };
  }

}
You find the complete source code for the application on GitHub.